How Manoj Bootstrapped Infography to $40K in 5 Months
Who is Manoj R?
Manoj R is an AI startup founder who began as a manual tester and successfully transitioned to creating Infography; he attributes part of his learning and success to mentors on YouTube.
What problem does Infography solve?
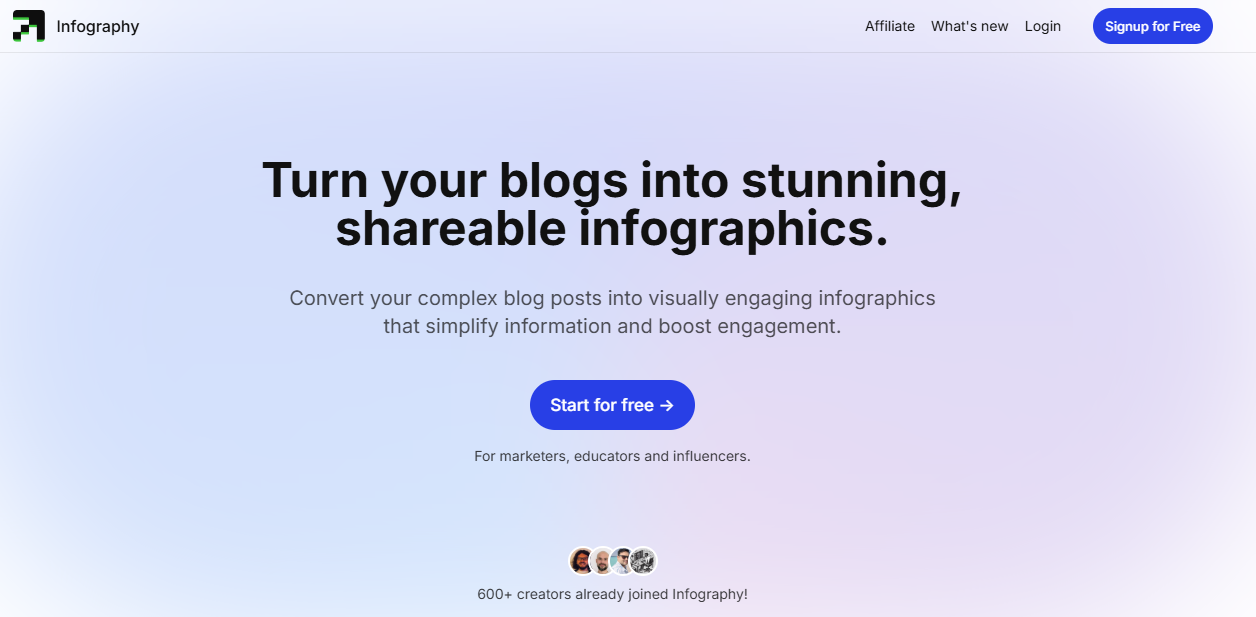
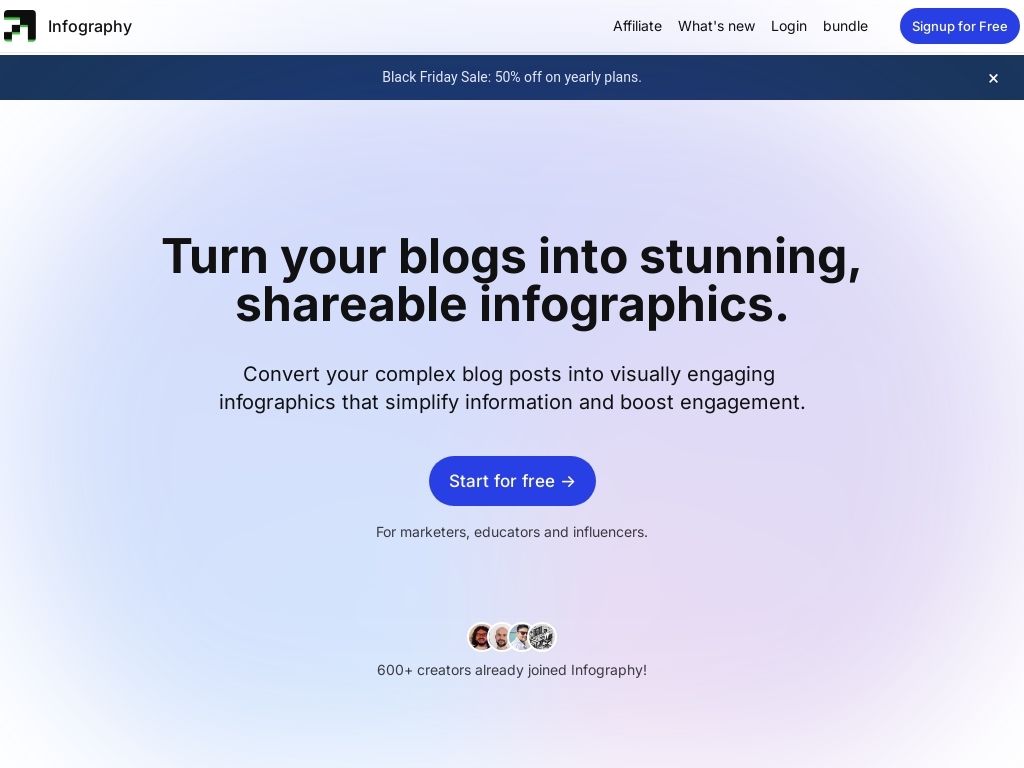
Infography helps businesses transform lengthy content into eye-catching infographics, making information easier to digest and share, thus boosting engagement and reach.
How did Manoj come up with the idea for Infography?
After struggling to effectively market his first product due to a lack of marketing knowledge, Manoj realized he needed a better strategy. Despite hiring an SEO analyst to promote on social media, he saw little success due to the analyst's limited understanding of his niche. He shifted his approach by crafting high-quality infographics from blog posts, which surprisingly attracted more attention and engagement from his followers.
This experiment with infographics sparked an idea: many businesses might also need a tool to easily create engaging visuals for marketing. To validate this idea, Manoj created a waitlist page and shared it on subreddits, receiving substantial feedback and interest. This feedback was critical, allowing him to refine his idea and prioritize key features before development.
How did Manoj R build the initial version of Infography?
Infography was developed as an AI-powered tool that leverages the GPT-40 mini language model to transform long-form blog posts into visually compelling infographics. The development process included utilizing AI to handle various input formats, from blog URLs to PDF files, allowing the tool to support over 130 languages.
Initially, Manoj R did not have a strong marketing strategy and faced challenges generating traffic, but iteratively adapted the product to meet user demands through feedback obtained from subreddits and pre-order customers.
The manufacturing and testing phase involved building a straightforward, intuitive interface that prioritized ease of use and offered customization options like aspect ratio and language selection, as well as a library of templates.
Developing the first version of Infography took concerted effort to ensure the infographics were visually rich and professionally designed, although some early outputs required further refinement and polishing to meet quality expectations.
What was the growth strategy for Infography and how did they scale?
Social Media and Infographics
Infography initially struggled with social media traction, but discovered that infographics were an effective way to engage users. By creating visually appealing infographics, they caught the attention of both existing and potential followers. This approach leveraged the visual nature of platforms like LinkedIn, where infographics are gaining popularity. Infographics were shared across various channels, drawing attention and helping to grow their audience.
Why it worked: The visually rich and easily shareable format of infographics stood out among typical social media content, leading to increased engagement and followership. By repurposing long-form content into infographics, Infography effectively utilized their existing resources to engage and attract users interested in visual storytelling.
Affiliate Marketing
Infography achieved significant growth through affiliate marketers. These partners helped spread the word about the tool to a broader audience. The affiliates' influence and networks allowed Infography to reach potential customers who might not have been accessible through traditional marketing means.
Why it worked: Leveraging affiliates tapped into the power of word-of-mouth and personal recommendations, which are highly effective in converting prospects into customers. Affiliates provided credibility and reached specific communities that valued recommendations from trusted sources.
Subreddit Engagement
Engaging directly with user communities on subreddits was another key strategy. Infography shared their waitlist page on related subreddits to gather feedback and generate early interest. This approach not only provided valuable insights but also led to a substantial increase in visitors and waitlist sign-ups.
Why it worked: Direct engagement on niche platforms allowed Infography to connect with a targeted audience that was already interested in the product space. This method facilitated valuable feedback and pre-sales, making it a cost-effective way to validate the product and increase initial user acquisition.
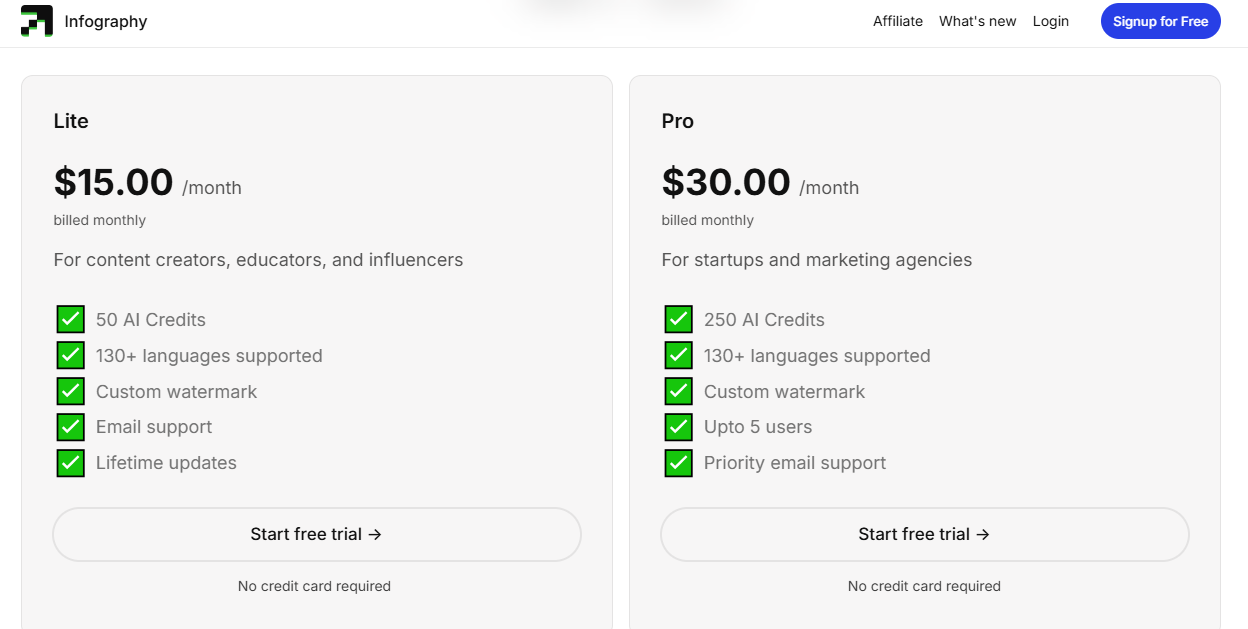
What's the pricing strategy for Infography?
Infography offers Lite and Pro plans starting @ $15/Mo and $30/Mo respectively.
What were the biggest lessons learned from building Infography?
- Leverage Community Feedback: Infography engaged subreddits to gather user feedback, which was crucial in understanding what features to prioritize. For aspiring founders, tapping into communities can provide honest insights and help shape a product effectively.
- Validate and Pre-Sell Ideas: Before full-scale development, Infography validated their idea by offering pre-orders on their waitlist page. This not only gauged interest but also generated early revenue. Founders should consider testing the market before investing heavily in development.
- Adapt Marketing Tactics: Initially, Infography struggled with traffic due to limited online presence. By pivoting to infographics and engaging with existing followers, they found a strategy that worked. Founders should be flexible and willing to adjust their marketing approach based on results and feedback.
- Prioritize Customer Interaction: Engaging with customers and resolving support tickets helped Infography refine their product and cultivate customer loyalty. Ensuring open communication channels is vital for improvement and customer satisfaction.
- Utilize Affiliates for Growth: Infography credits a significant part of their milestone to affiliate marketers. Engaging partners or affiliates can amplify your reach and boost sales efficiently. Founders should explore affiliate marketing as a cost-effective growth strategy.
Discover Similar Business Ideas Like Infography
|
|
Idea
|
Revenue
|
|---|---|---|
|
PDFShift
|
HTML-to-PDF conversion API service.
|
$8.5K
monthly
|
|
SiteGPT
|
AI chatbot trained on your website content.
|
$15K
monthly
|
|
Hallow
|
"Catholic prayer and meditation app fostering faith growth."
|
$278K
monthly
|
|
tiiny.host
|
Static website hosting made simple for everyone.
|
$15K
monthly
|
|
Studio Wombat
|
WooCommerce plugin developer for enhanced e-commerce features.
|
$15K
monthly
|
|
Treendly
|
Trend-spotting platform for untapped market insights.
|
$1K
monthly
|
|
ScreenshotOne
|
API for capturing website screenshots easily.
|
$2.2K
monthly
|


More about Infography:
Who is the owner of Infography?
Manoj R is the founder of Infography.
When did Manoj R start Infography?
2024
What is Manoj R's net worth?
Manoj R's business makes an average of $8K/month.
How much money has Manoj R made from Infography?
Manoj R started the business in 2024, and currently makes an average of $96K/year.
Download the report and join our email newsletter packed with business ideas and money-making opportunities, backed by real-life case studies.
Download the report and join our email newsletter packed with business ideas and money-making opportunities, backed by real-life case studies.
Download the report and join our email newsletter packed with business ideas and money-making opportunities, backed by real-life case studies.
Download the report and join our email newsletter packed with business ideas and money-making opportunities, backed by real-life case studies.
Download the report and join our email newsletter packed with business ideas and money-making opportunities, backed by real-life case studies.
Download the report and join our email newsletter packed with business ideas and money-making opportunities, backed by real-life case studies.
Download the report and join our email newsletter packed with business ideas and money-making opportunities, backed by real-life case studies.
Download the report and join our email newsletter packed with business ideas and money-making opportunities, backed by real-life case studies.