Data Visualization Service Success Stories [2026]
In a data-driven world, making complex information understandable is gold. Starting a data visualization service involves transforming intricate data into clear, visual formats like charts, graphs, and dashboards.
The core idea is to help businesses and organizations make data-driven decisions by presenting their data in an accessible and insightful manner. You'll collaborate with clients to identify key metrics and design visual representations that simplify data interpretation.
This venture requires proficiency in tools like Tableau or Power BI, an understanding of data analytics, and strong design skills. It’s an appealing business because as data continues to grow, so does the demand for making it digestible.
If you’re seeking a business idea that combines technical skill with creative design, a data visualization service offers both challenge and opportunity. Not only do you empower clients with actionable insights, but you also play a pivotal role in shaping informed decision-making.
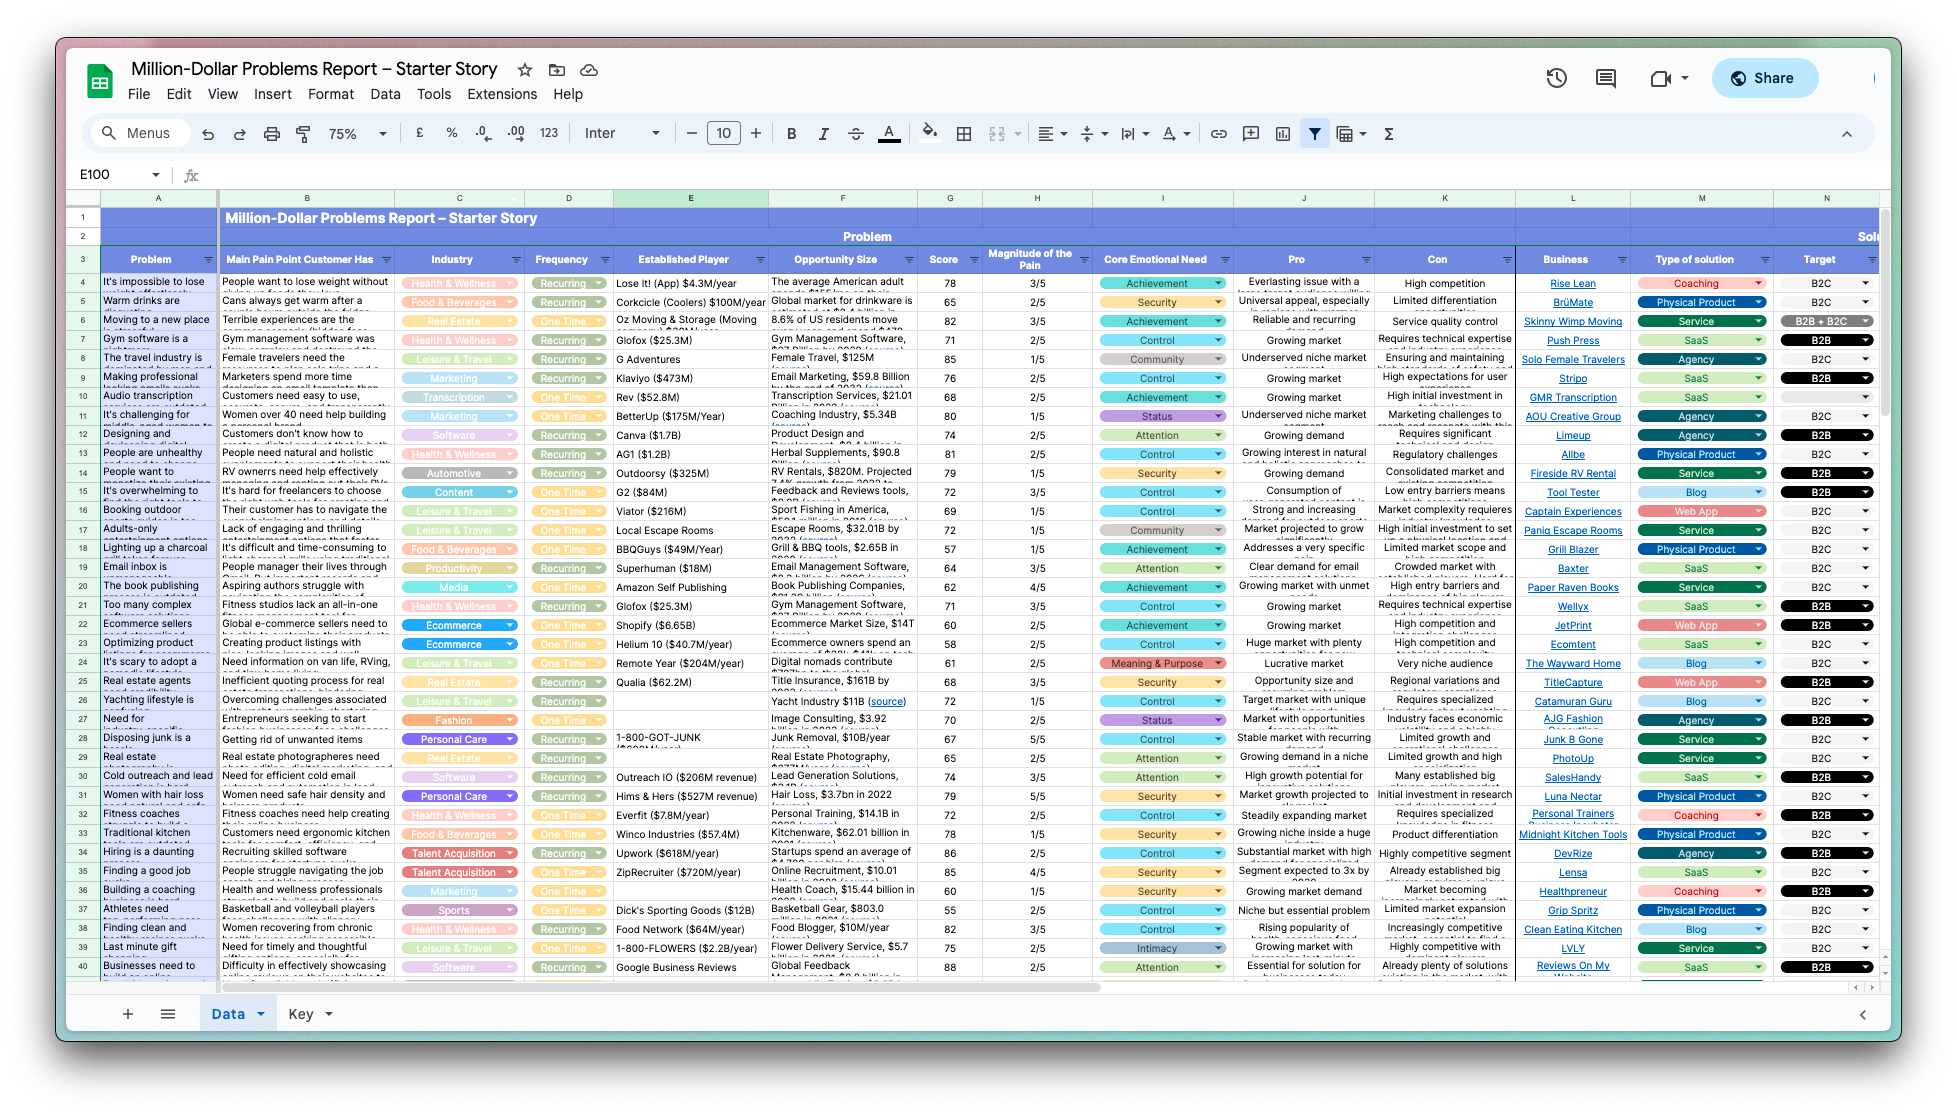
In this list, you'll find real-world data visualization service success stories and very profitable examples of starting a data visualization service that makes money.
1. Coinpanda ($420K/year)
Eivind Semb, the founder of Coinpanda, came up with the idea for his business after struggling to calculate and report his own cryptocurrency taxes. Realizing that there were not many great products on the market, he saw an opportunity to create a user-friendly solution. Despite having no experience in software development, he hired remote developers and spent several months designing and prototyping the product before launching.
How much money it makes: $420K/year
How many people on the team: 5
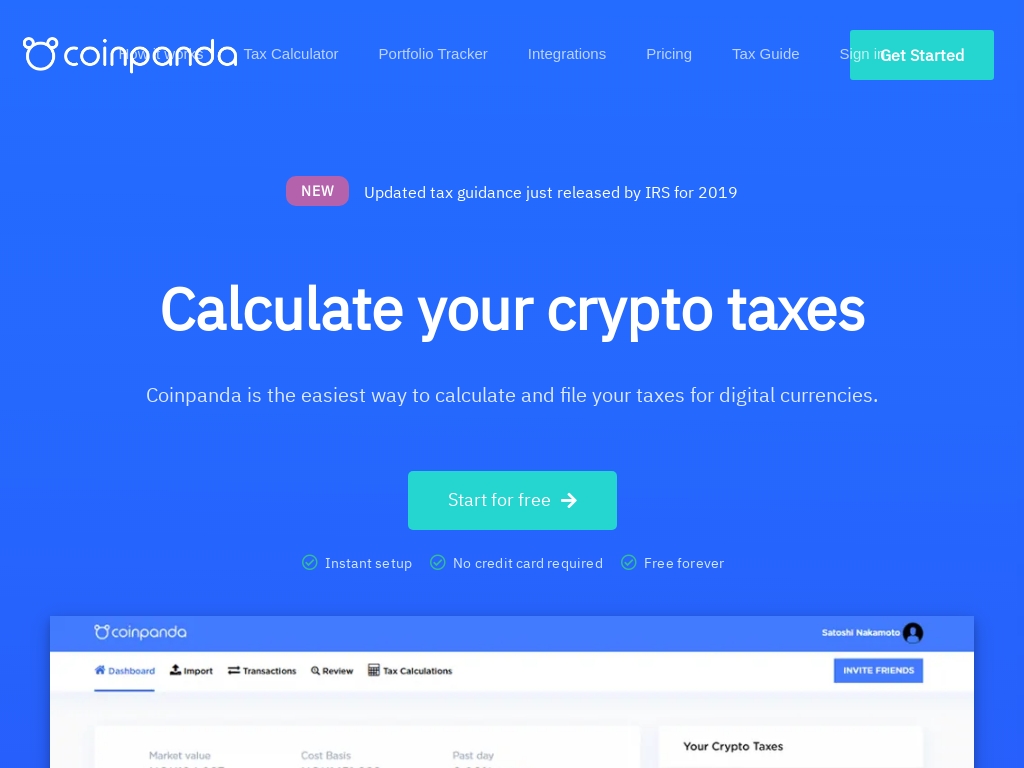

Coinpanda is a cryptocurrency tax solution for traders and investors, offering a free portfolio tracker in addition to a tax solution that can calculate taxes and capital gains for over 7,000 cryptocurrencies and is integrated with over 100 exchanges, blockchains, and services, generating $85,000 in revenue with a 75% profit margin in Q1.


2. Inquizity Metanoia ($360K/year)
Ramesh Krishnamurthy, an IIM Ahmedabad alumnus, identified a gap in supply chain planning during his SAP ERP implementation in a jewelry factory. Seeing many companies still relying on Excel for planning, he founded Inquizity, now serving over 120 clients with cutting-edge solutions like dataSAVI.
How much money it makes: $360K/year
How much did it cost to start: $45K
How many people on the team: 25
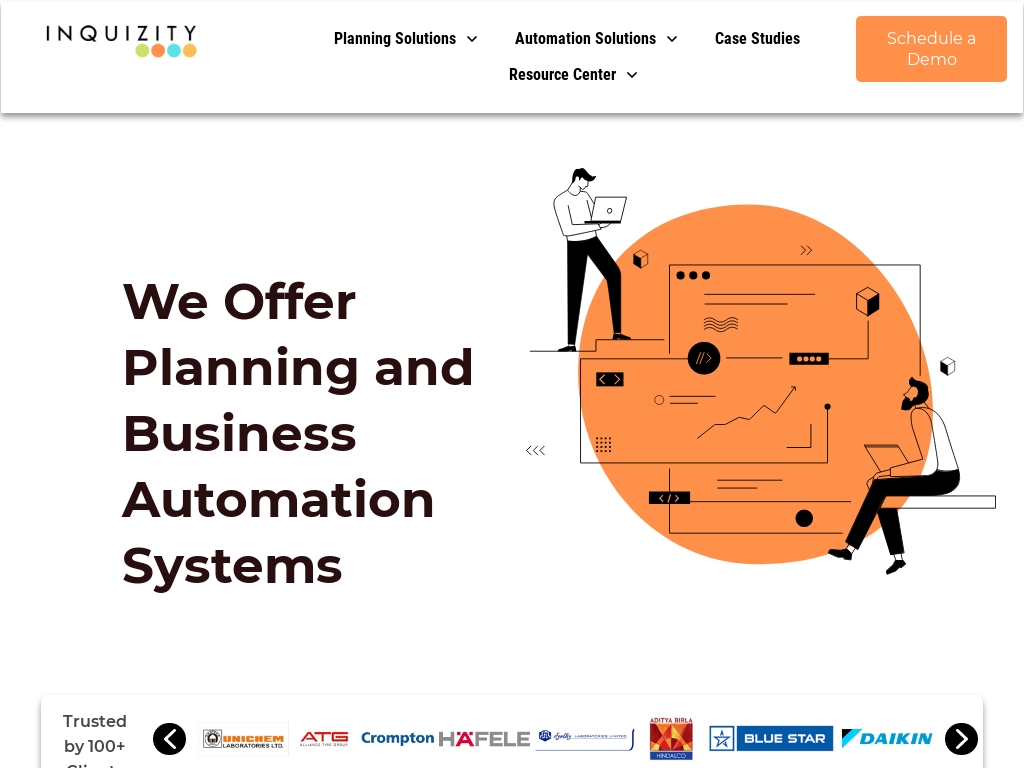

Inquizity, a B2B supply chain solutions company founded by Ramesh Krishnamurthy, developed an end-to-end supply chain planning solution that includes 120+ clients across various industries and a low-code PWA-based automation platform called dataSAVI, which helped the company bring in over $30K per month.


3. Statful ($102K/year)
Statful was initially developed by Mindera, a tech services company, to meet their own need for a monitoring tool. They wanted a tool that could communicate what was happening in their applications to both developers and businesses. They found that existing tools in the market were either too expensive or required extensive deployment and maintenance. This led them to create Statful, a customizable monitoring platform that provides real-time data and flexibility for developers, operations, and business teams. Despite minimal investment in marketing and sales, Statful has gained six customers from various industries and reached an MRR of approximately $10,000.
How much money it makes: $102K/year
How much did it cost to start: $250K
How many people on the team: 5
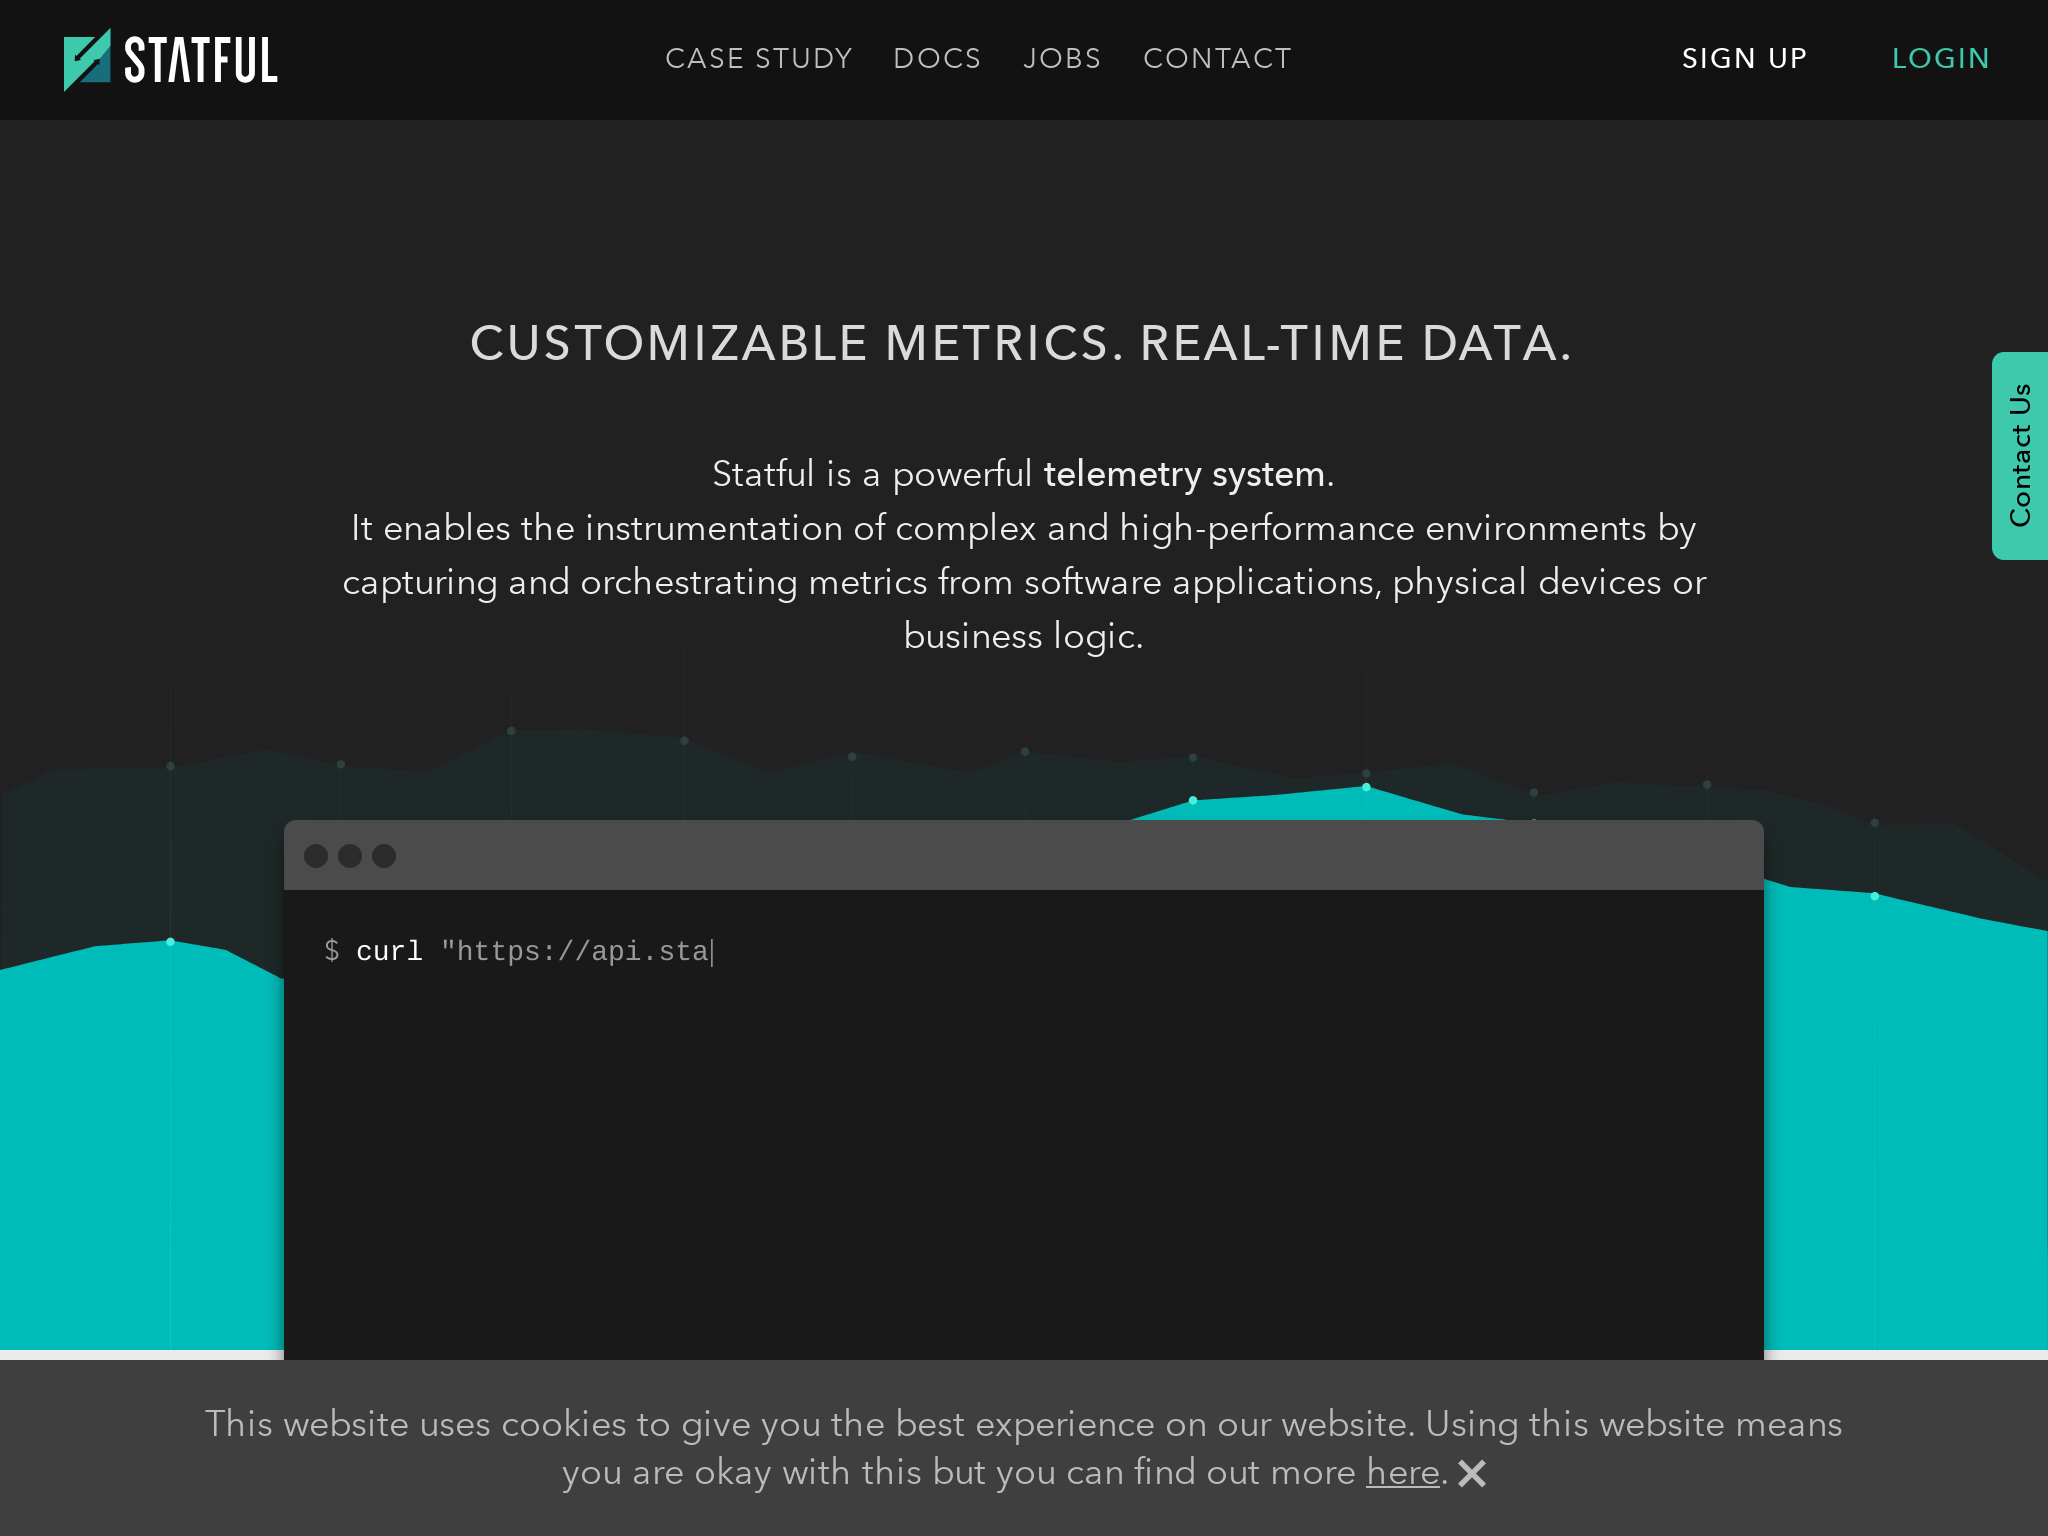

Statful, a monitoring platform to track any type of metric, managed to get six customers and reach an MRR of approximately $10,000 without any real investments in marketing and sales.